Measuring Impact with the MapGive Dashboard, Worldwide
User contributions to OpenStreetMap can be shown by country and time
The MapGive team is proud to launch the MapGive Dashboard that highlights contributions to OpenStreetMap (OSM) projects supported by MapGive. MapGive primarily supports remote mapping projects designed and identified by organizations working on the ground in local communities. Digital volunteers can trace satellite imagery to identify buildings and roads in priority geographic areas to create map data that directly supports programs implemented by humanitarian and development organizations. Since MapGive’s launch in 2014, over 17 thousand unique users have created more than 2 million buildings and 180,000 roads using #MapGive, all of which is openly available through OSM!
You can use the MapGive Dashboard to explore where and when the #MapGive hashtag was used in a user's contribution to OSM. Mappers using the Humanitarian OpenStreetMap Team's (HOT) Tasking Manager can find the #MapGive hashtag included in the changeset comments of any project supported by MapGive. To date, MapGive has published over 240 satellite imagery services to support the open mapping community and facilitated dozens of mapathons in support of these projects.
MapGive contributions have steadily increased since the 2014 launch. Contributions visibly spike whenever MapGive focuses support on critical humanitarian response efforts and every November as MapGive and the OSM community celebrates OSM Geography Awareness Week. The following events were noteworthy humanitarian emergencies where MapGive mobilized support to rapid mapping efforts that tangibly improved response efforts:
July 2014: Ebola Outbreak, West AfricaThe West Africa Ebola epidemic was the largest Ebola epidemic in history. It began with the first recorded case in Guinea in December 2013. The disease spread to Liberia and Sierra Leone, and by July 2014, all three capitals were struggling to deal with the epidemic. MapGive provided huge swaths of imagery services for Liberia and Sierra Leone, and hosted mapathons with the American Red Cross that mobilized hundreds of volunteers. Deployed response teams made use of updated OSM data for logistics and planning.
Dec 2014: Typhoon Hagupit (Ruby), PhilippinesTyphoon Hagupit (Ruby) was a category 3 typhoon that hit the Philippines on December 6th 2014. The MapGive team collaborated with HOTOSM imagery coordination team and coordinated imagery requests for satellite imagery along the typhoon’s path. Pre-disaster imagery was supplied within days of the typhoon making landfall, focusing over Samar Island.
April 2015: Earthquake Response, NepalA 7.8 magnitude earthquake struck Nepal on April 25, 2015. The earthquake and aftershocks resulted in about 9,000 deaths and over 22,000 injuries. Many different imagery providers coordinated in providing satellite imagery immediately following the disaster for the OpenStreetMap response. The MapGive team contributed a few crucial pre-disaster scenes in the Gorkha region northwest of Kathmandu.
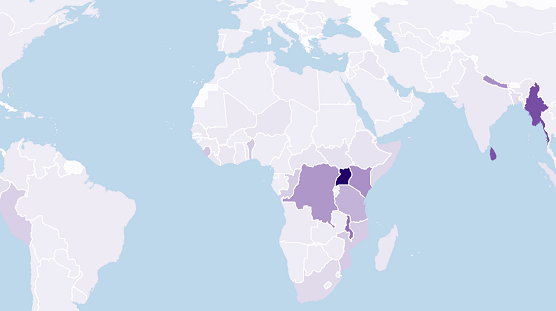
2017: Multi-pronged Mapping Efforts, Uganda2017 & 2018: Rohingya Refugee Crisis, Burma
- MapGive published numerous satellite imagery services to support a State/PRM-funded project implemented by HOT to comprehensively map South Sudanese refugee settlements and the surrounding host communities in northern Uganda. These maps and data continue to be used across the humanitarian coordination system in Uganda to support South Sudanese and other refugee populations.
- MapGive supported a PEPFAR Open Mapping Initiative around Lake Victoria.
Immediately following the massive influx of Rohingya refugees into Bangladesh, resulting in rapid growth of refugee settlements in Cox’s Bazar. MapGive rapidly published satellite imagery services through efforts led by HOT, MSF, IOM, REACH, and others, these settlements were comprehensively mapped to improve coordination and the provision of essential services such as shelter, water, and food.
We encourage you to try out the dashboard for yourself. This tool is enabling our team to make use of data to help us reflect on our past work, find gaps, and feed into our ongoing outreach efforts. It helps us measure our impact and set new goals. We look forward to continuing our partnerships with the humanitarian community and working together to map the world.
Technical note and acknowledgements: this dashboard is possible due to the work from Amazon Web Services and by Seth Fitzsimmons in making OSM data publicaly queryable using Amazon Athena. The backend metrics aggregator (points-in-polygon repository), and frontend code (MapGive repository) are all open source and available on Github.